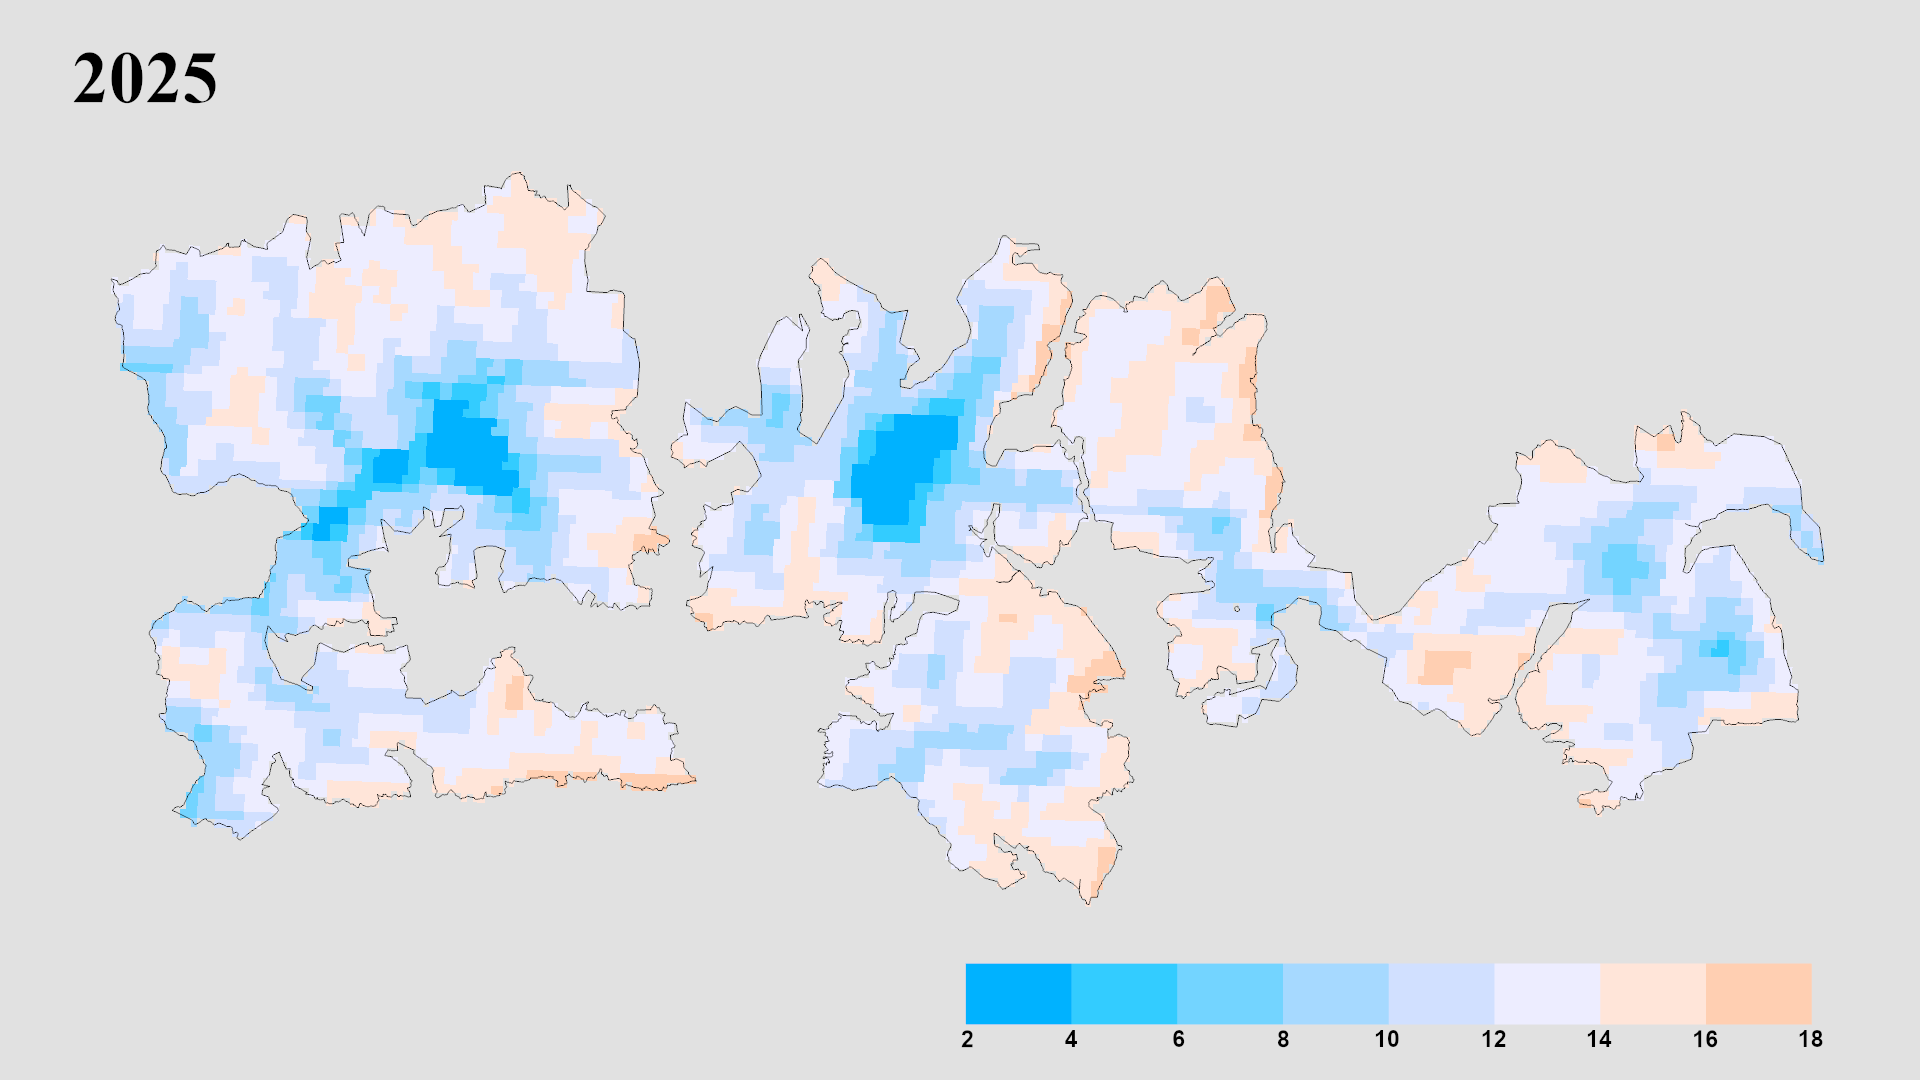
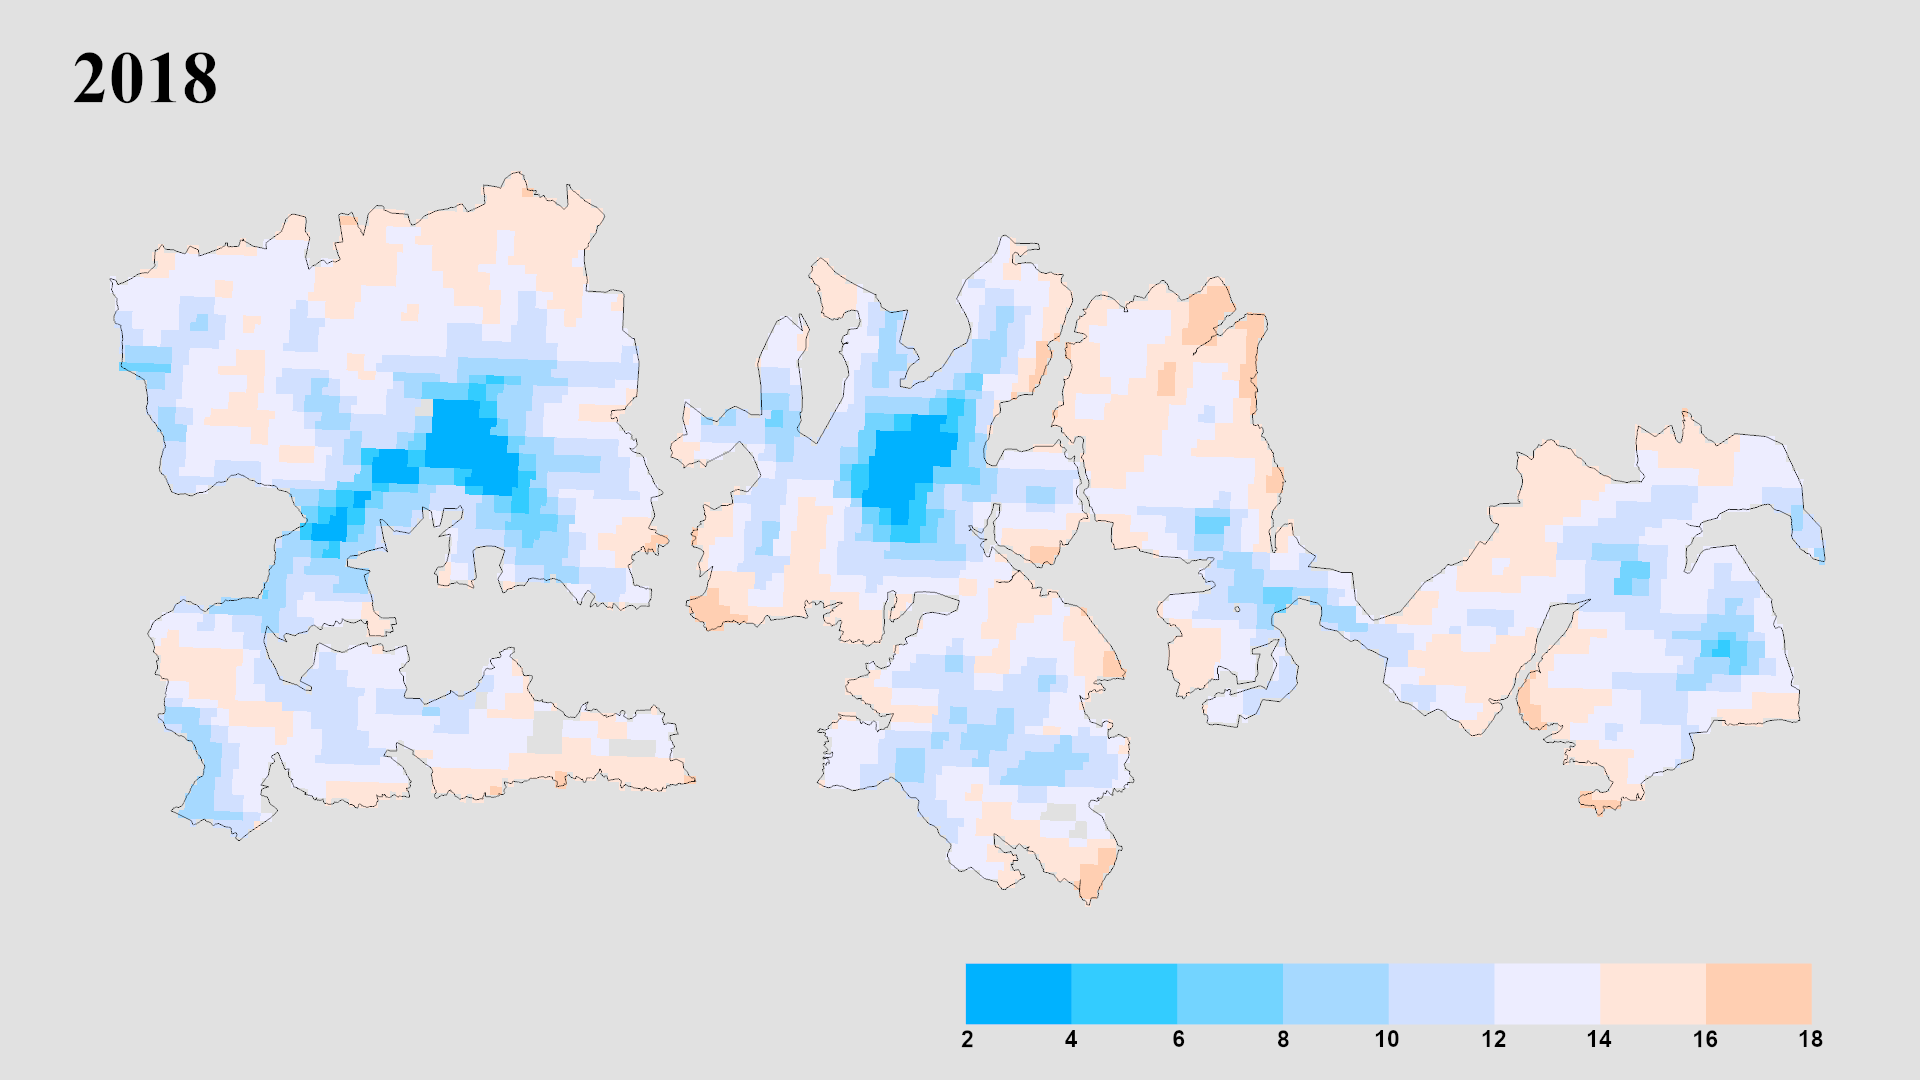
This tool reuses the seasonal composite figures from the Results chapter. Each grid image is sliced client-side into 8 per-year tiles (using the grid layout that matches the source figure) so every tile shows the same geographic extent when you swap years.
Comparison
❄ Interactive Time Series
Multi-Year Snow Variability Tool
Mean Land Surface Temperature (°C) during the depletion season across Hohe Tauern National Park. Drag the slider to compare any two years from 2018–2025.
vs
⇔
Click a year to load it on the right