Methodology
From baseline survey to validated atlas
Seven stages, run with authoritative Nigerian datasets and refined through two rounds of user testing.
Seven Stages
From research to a finished atlas
Each stage builds on the last, looping back through documentation from initial research to final production.

Documentation ran throughout, from research to atlas production, looping back to inform the thesis itself.
Research
Baseline survey and literature review to establish the state of tactile mapping in Nigeria.
Topics selection
28 topics curated against the national geography curriculum, across World, Africa, and Nigeria scales.
Data gathering and processing
Authoritative datasets sourced from NiMet, NBS, Copernicus, Esri, and OSM, then generalised for tactile use.
Test map creation
Prototype maps designed to tactile cartography standards: hatch textures, low-saturation colour, 24-pt braille.
User testing
Tactile testing in Prague, iterative improvement, then local testing with 11 blind students in Nigeria. See the full Validation & User Testing below.
Map improvement
Hatch spacing, symbol size, and braille padding refined from direct student feedback.
Atlas production
All 40 maps, charts, and audio tracks finalised into the complete Tactile Atlas of Nigeria.
Software & tools
ArcGIS Pro 3.6/3.7 for design, ArcGIS Survey123 for questionnaires, Microsoft Excel for analysis.
Literature Review
Designing within real physical limits
This decision was made almost entirely on paper, before a single tactile page was tested: how coarse human touch actually is. See the homepage for why microcapsule (swell) paper was chosen as the production method.
Designing within the limits of touch
Human tactile perception distinguishes elements only ~2.4mm apart, far coarser than vision. Every atlas page was built inside these literature-derived limits.
2.4mm
minimum spacing to tactilely distinguish two elements
10-15
distinct symbols permitted per map
4-6
area textures permitted per map
24pt
minimum Braille size
0.5-2mm
line-width hierarchy, thinnest to thickest feature
3mm
minimum distance between adjacent symbols
Validation & User Testing
Three rounds of testing, two countries, two experts
Every design decision in the atlas traces back to a testing session: first isolating tactile parameters in Prague, then validating real-world classroom use in Nigeria, then a dedicated expert review before final print.
Phase 1 · Prague, Czechia
Tactile Parameter Evaluation
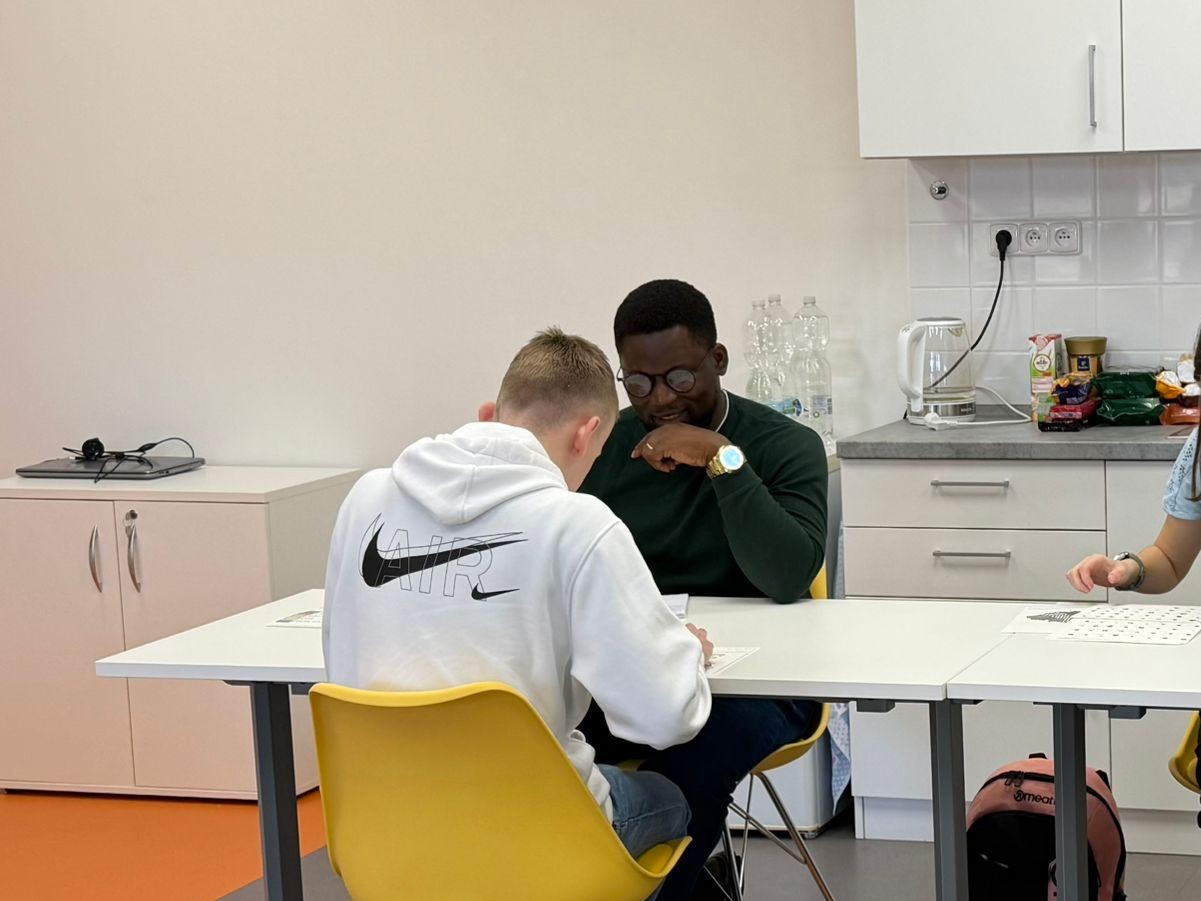
Grammar School and Secondary School for Students with Visual Impairments, Prague. An initial empirical study to isolate and refine core tactile parameters before scaling to Nigeria.
4
participants
2 male · 2 female
5 / 12
map tasks solved
100% correctly
26
follow-up
usability questions
Every participant tested every prototype, with a researcher reading each task aloud and logging responses in ArcGIS Survey123. The cohort spanned blindness, low vision, and colour blindness, with two of four participants reading Braille and prior exposure to tactile maps ranging from none to extensive. The Africa political map, though intuitive to sighted eyes, failed almost completely by touch: fingers couldn't separate Braille labels from the surrounding linework. That single failure drove the biggest fix, splitting the map into five regional maps, alongside widened hatch spacing, enlarged and hollowed-out symbols, and boundaries and transport lines set apart by thickness.

Phase 2 · Nigeria (FCT, Lagos, Ekiti)
Local Context Applicability Validation
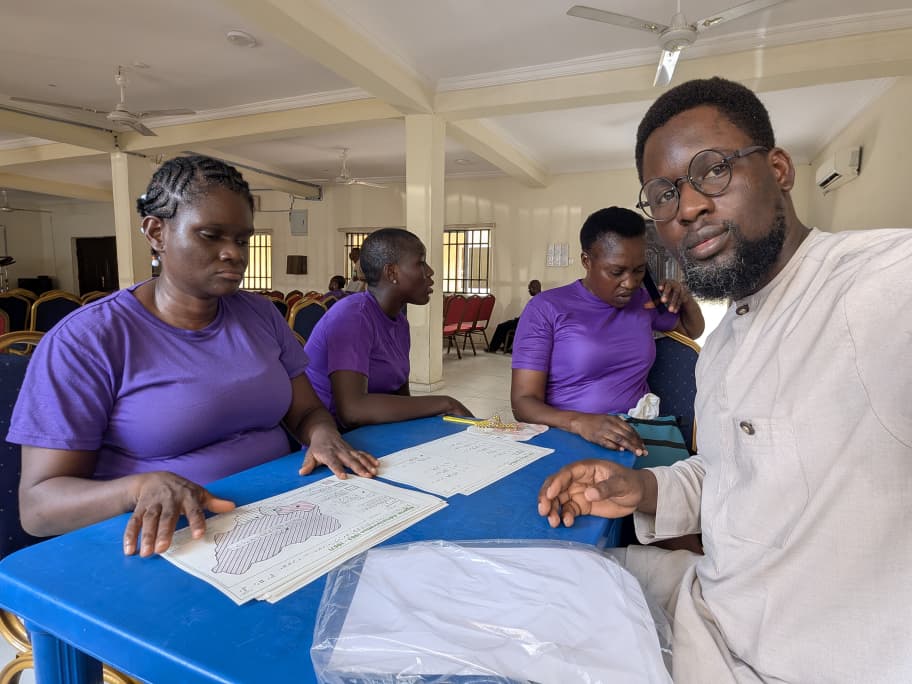
Three schools: Bethesda Home for the Blind (Surulere, Lagos); Government Special School for the Blind (Ikere-Ekiti); Government Secondary School (Kwali, FCT), April to May 2026.
11
participants
all blind, 18+
11 / 11
improved their
overall score
23
map-based tasks
per participant
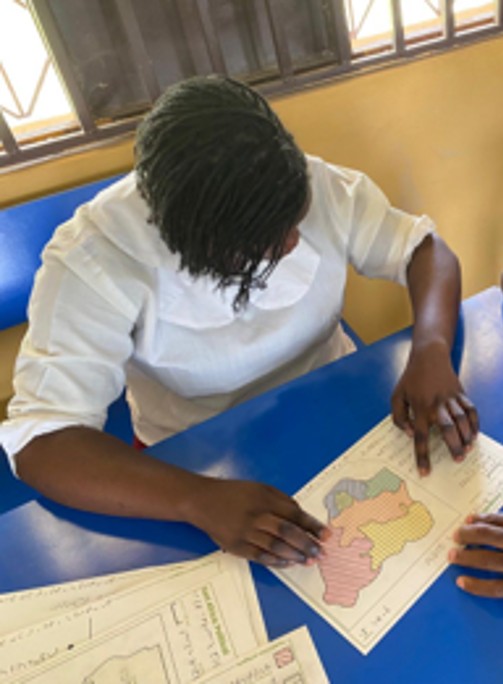
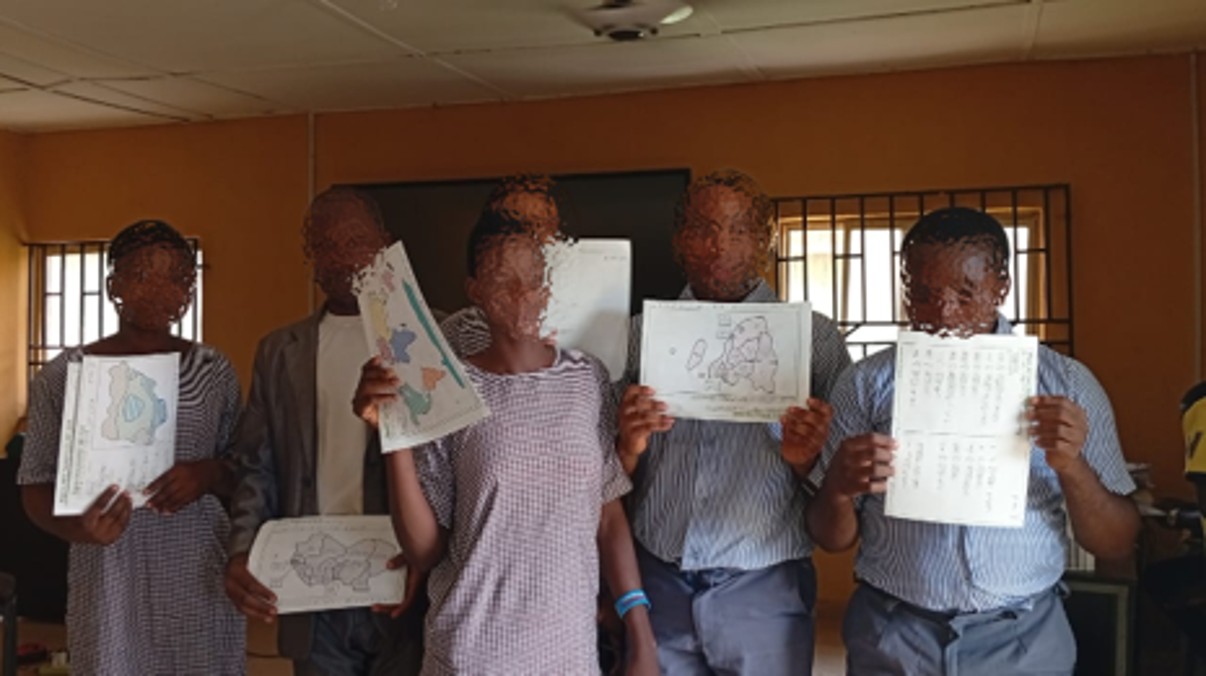
Every participant was meeting a tactile map for the first time, so each was asked the same set of questions before and after using the atlas, to measure what the maps actually taught. Nearly every participant stumbled on the same task regardless: reading the scale bar to estimate the width of Sudan on the East Africa political map, a spatial-literacy skill rather than a map defect. Their teachers noticed the difference anyway, and asked for more. A scale-reading guide was added to the atlas's how-to-use page in response, the World map was reduced from 8 to 7 continents to match the Nigerian curriculum, and multiple map sets were produced per session after the originals began wearing out under repeated handling.
Third pass · Expert Review
Cartographic and pedagogical review
A final qualitative review pass before print, a dedicated cartographic and pedagogical review as described in the manuscript was conducted with the following experts.
RNDr. Alena Vondráková, Ph.D., LL.M.
UPOL Supervisor · Dept. of Geoinformatics
A full production pass across text, layout, and cartographic accuracy: from Braille grammar to map-frame and scale recalculation.
Dr. Veronika Růžičková
Faculty of Pedagogy, UPOL
Pedagogical consultation on symbology and map communication: confirming what worked and refining what didn't, from chart design to political-map representation.
Changes made after expert review
Text & layout
Braille grammar and capitalization corrected; imprint page and Braille table of contents added; page numbers right-aligned; cover/back logo orientation and audio-track numbering fixed; printed transcripts added.
Cartographic accuracy
Map frames and scale statements recalculated across projections; legend sizing corrected to match on-map symbols; graphical-scale representation refined.
Symbology & texture
Sea texture added around continents; colour halos on black symbols; white boundaries between textures and natural-phenomenon boundaries; ambiguous cross (+) point symbol flagged for rotation or replacement; exterior symbols for features too small to contain them.
Political maps
Each entity to get a unique fill colour plus a capital-city point symbol; a dedicated water symbol proposed; surrounding entities drawn with dotted lines.
Charts & divider pages
Tactile bar charts narrowed with closer spacing; divider pages show the full globe instead of an isolated region, for spatial context.
