Diploma thesis · Copernicus Master in Digital Earth · 2026
Data-Driven Wildfire Spread Modeling Using Earth Observation Data with Interactive 3D Visualization in Unity
Author
Marcelo Rigoto
Supervisor (UPOL)
Jan Brus
Supervisor (PLUS)
Karima Habad
Year and place
2026, Olomouc and Salzburg
Department of Geoinformatics, Faculty of Science, Palacký University Olomouc
Department of Geoinformatics, Faculty of Digital and Analytical Sciences, Paris Lodron University Salzburg
Erasmus Mundus Joint Master Degree programme, Copernicus Master in Digital Earth, track Geovisualization and Geocommunication. Developed with the support of the Erasmus+ programme of the European Union.
Detection markers scaled by fire radiative power, day by day
32,722hectares burned, Jasper 2024
25,000people evacuated
64user study participants
3tools compared
01 Introduction
Wildfire seasons have grown longer, more frequent and more intense in recent decades, demanding better tools for public awareness and decision support. Commonly used GIS dashboards and scientific simulators provide rich data but often lack the narrative clarity and visual polish needed to engage non-technical audiences. Traditional 2D interfaces face limitations: users have restricted screen space and limited depth perception, which can make it difficult to understand complex temporal and spatial relationships.
In this thesis, a purely visual, time-lapse wildfire visualization pipeline built entirely in Unity3D is presented. The modular framework ingests open-source geospatial datasets, from Cesium elevation models to NASA FIRMS hotspot points, reads them through .NET libraries and converts them into terrain meshes, raster overlays and particle-based hotspot emitters. A clustering algorithm groups wildfire detections within a configurable spatial radius over a specified number of days and scales marker size to intuitively communicate fire intensity. All spatial layers and effects are sequenced on the Unity Timeline, enabling interactive scrubbing of the daily progression.
The term modelling is used here in the descriptive sense. The system does not forecast fire behaviour; it reconstructs, organizes and represents what satellites have already recorded, so that the extent, intensity and day-by-day progression of real events can be understood by non-specialist audiences.
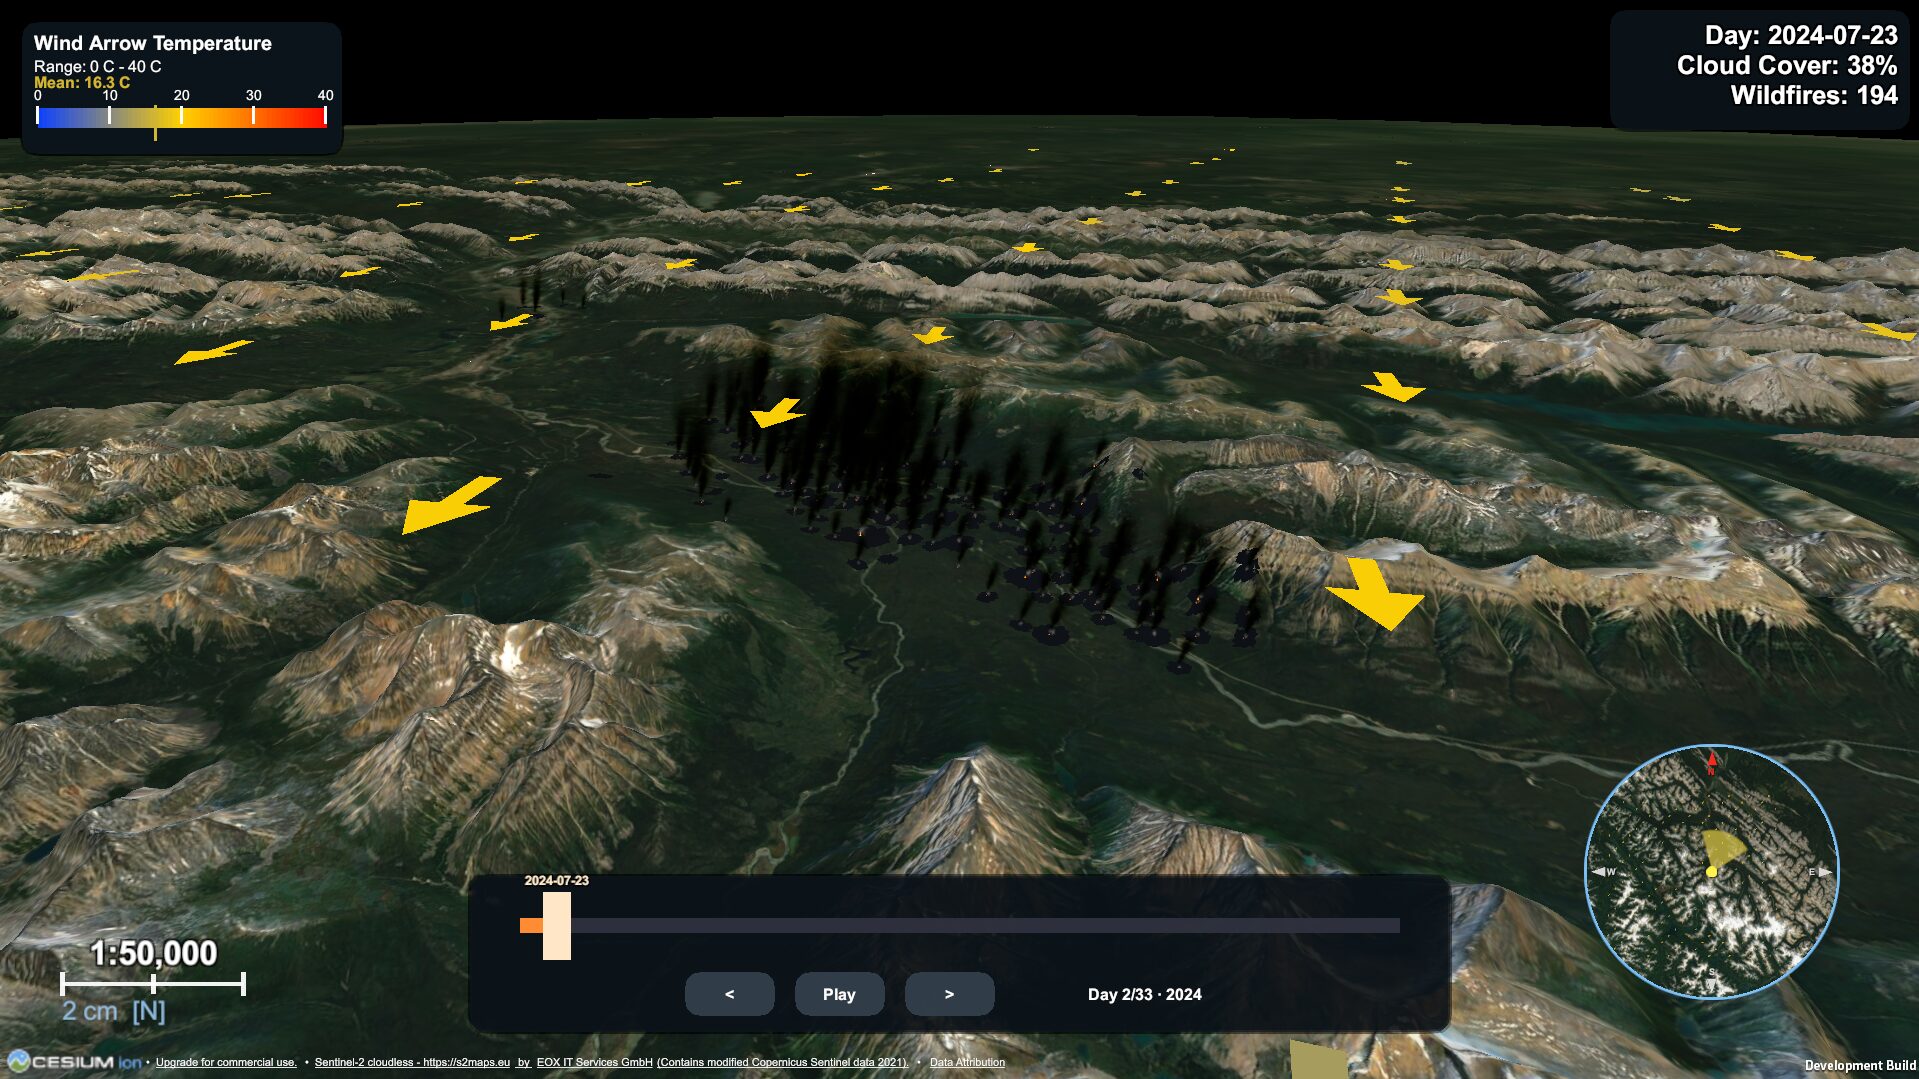
Figure 1: The desktop application rendering the 2024 Jasper wildfire on day two of the event, with smoke columns, wind arrows colored by temperature, timeline control and orientation minimap.
02 Objectives
The aim of the thesis is to design and implement a modular Unity3D application capable of creating purely visual wildfire time-lapses while avoiding dependence on any proprietary paid solution. The specific objectives are as follows:
To develop a workflow that allows the proper visualization of wildfire extent and temporal progression using satellite-derived fire detection data, with spatial clustering and Fire Radiative Power weighted marker scaling to faithfully represent detection density and fire intensity.
To enable users to identify spatial and temporal patterns, gain a better understanding of real events and navigate an immersive 3D environment through a day-by-day timeline animation.
To demonstrate that the complete pipeline can be implemented exclusively with open-source and freely licensed components, ensuring the workflow is reproducible and adaptable to future fire events by practitioners without a programming background.
To establish game engines, and Unity3D specifically, as a viable geovisualization platform capable of rendering georeferenced satellite data over accurate terrain.
03 Methods and materials
The methodology follows a three-phase pipeline designed to be self-contained within the Unity environment, requiring no external GIS software, no proprietary runtime licences and no manual intermediate data processing. In the first phase, fire detection records are retrieved from the NASA FIRMS API and weather data are fetched from Open-Meteo, with all outputs exported as open-standard geospatial files. In the second phase, those files are loaded into Unity, geographic coordinates are converted to Unity world positions through the Cesium for Unity coordinate transformation infrastructure and fire detections are clustered before animated 3D markers are spawned on the photorealistic globe. In the third phase, the user navigates a real-time 3D environment, controls a day-by-day temporal timeline and explores spatially contextualized fire, wind and temperature overlays.
Figure 2: Overview of the fire detection and visualization pipeline (placeholder).
Study area
The main scenario reconstructs the 2024 Jasper wildfire, a complex of fires that burned in Jasper National Park, Alberta, Canada, in July 2024. The fires forced the mass evacuation of 25,000 residents, workers and visitors, destroyed 358 of the 1,113 structures in the town of Jasper and reached a final size of 32,722 hectares. From the first ignition to the fire reaching the townsite less than 48 hours passed, which creates a short but extremely intense detection sequence that tests the ability of the platform to convey dramatic temporal acceleration.
Materials
The pipeline was built with Unity3D and Cesium for Unity for terrain streaming and georeferencing, NetTopologySuite for shapefile parsing, NASA FIRMS fire detection data, Open-Meteo weather data and a Digital Elevation Model streamed through Cesium. The application was delivered as two complementary builds, a full featured Windows desktop application and a browser-based WebGL version requiring no installation.
Figure 3: Study area, Jasper National Park, Alberta, Canada (placeholder).
04 The application
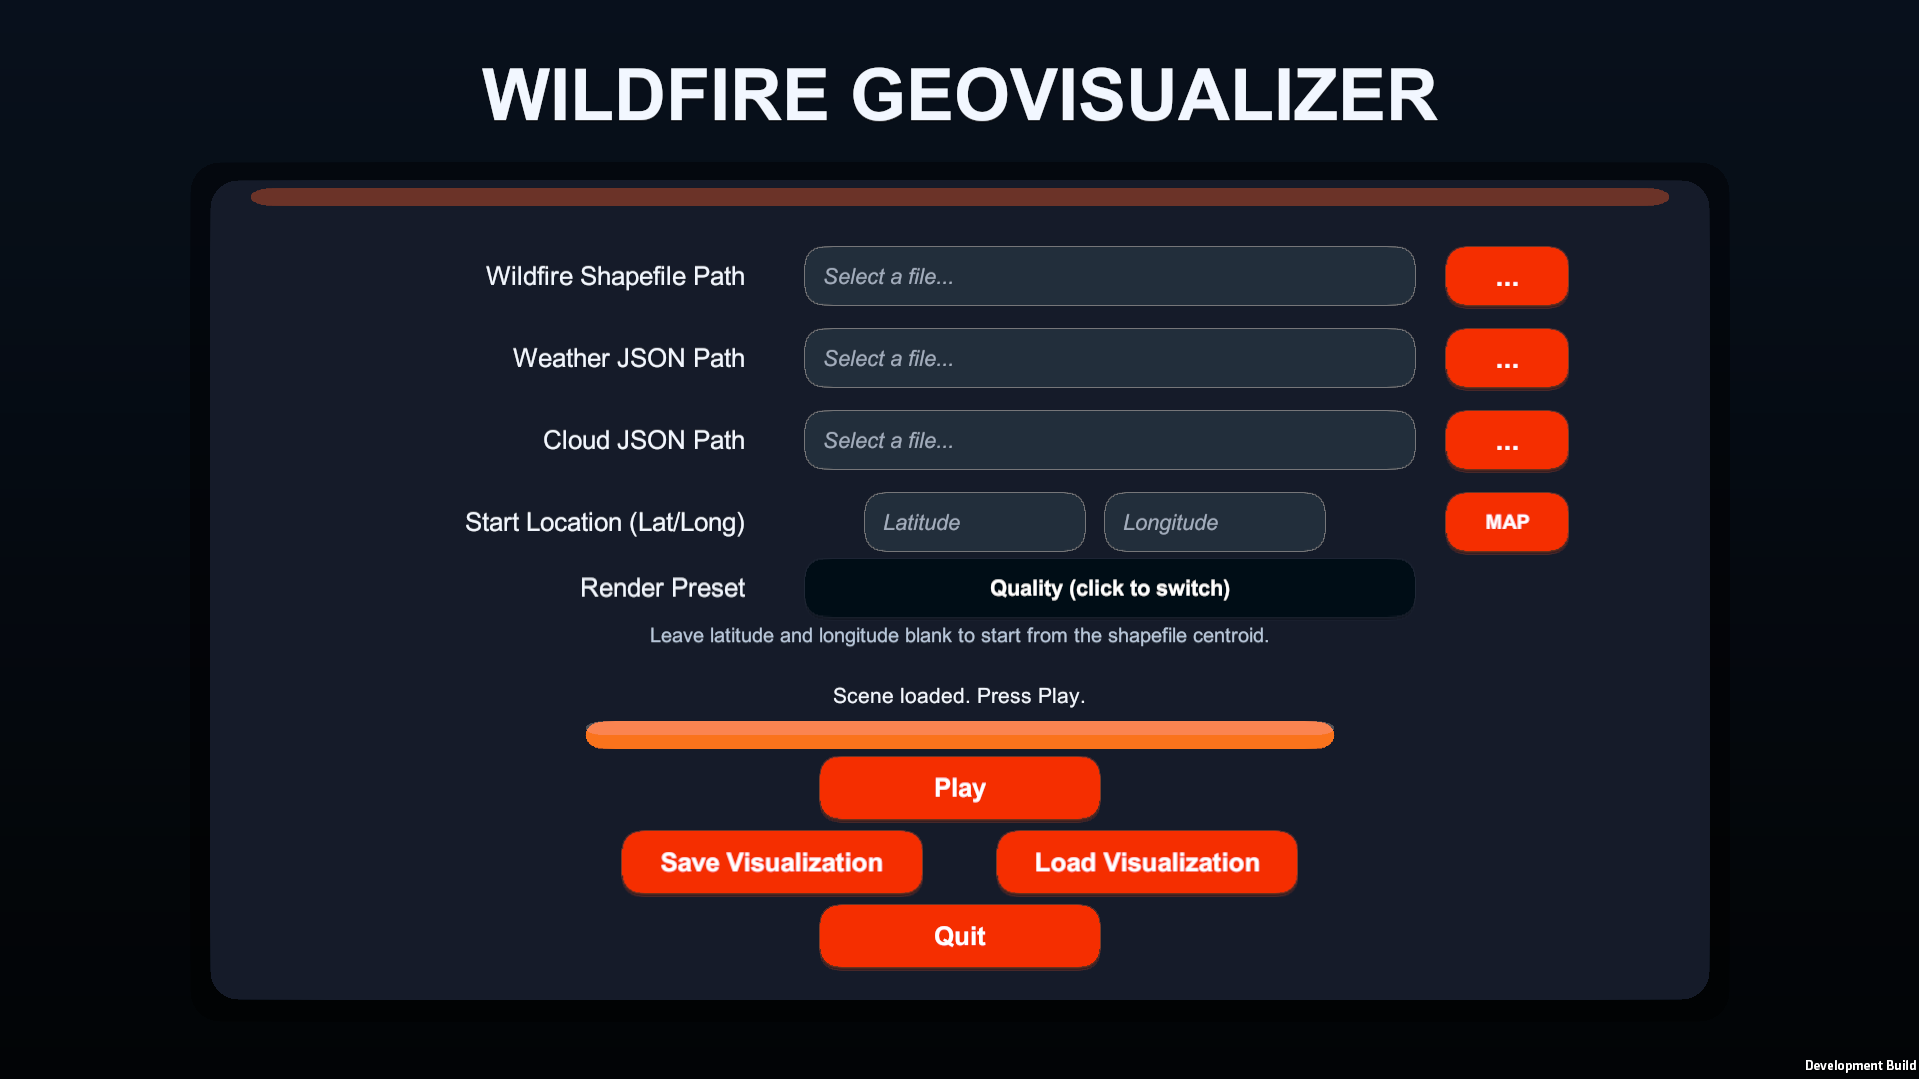
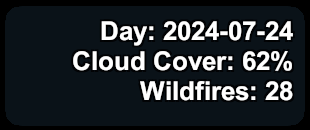
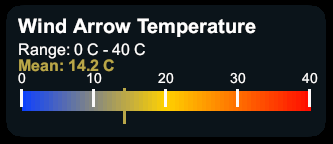
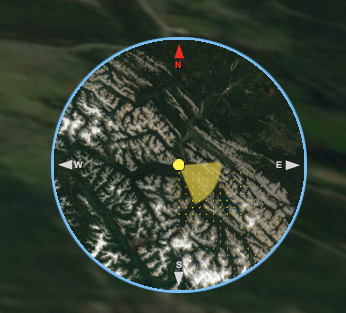
The application was delivered as two builds. The desktop build offers the full render quality shown below, while the WebGL build runs directly in the browser without installation. From the main menu, the wildfire shapefile, weather data and cloud data are selected, a start location is set and a render preset is chosen. The visualization is then explored through a day-by-day timeline, a heads-up display reporting the current day, cloud cover and detection count, a wind arrow overlay colored by temperature and an orientation minimap.
Figure 4: Main menu of the desktop application, where input data, start location and render preset are configured.
Figure 5: Timeline control for day-by-day navigation.Figure 6: Heads-up display with day, cloud cover and detection count.Figure 7: Wind arrow temperature legend.Figure 8: Orientation minimap with view cone and cardinal directions.
Run it in the browser
The WebGL build can be tested directly below or opened in a separate tab through the link. Loading the terrain tiles can take a moment on the first start.
A comparative user study was conducted in which the Unity application was evaluated against two established tools, kepler.gl and an ArcGIS Online application, each paired with an independent real wildfire scenario. Comprehension questions were asked only after the first tool encountered to avoid learning effects, usability was measured with a standard usability scale and six counterbalanced presentation orders were used. Sixty four participants completed the study.
Figure 9: The three compared tools and their scenarios (placeholder).
06 Results
The study found that terrain is not a cosmetic addition but a genuine precondition for correct understanding. Participants using the terrain-free comparator overwhelmingly misread a mountainous landscape as flat lowland, while both terrain-based tools converged on the correct answer. The Unity application led on identifying the day of greatest fire activity and on holding the attention of participants throughout the task, and it came within a few points of a mature commercial product on perceived quality while being built entirely from free and open-source components.
Caption placement follows the thesis template: table captions are placed above tables.
Table 1: Correct responses to the scored comprehension items, by the first tool encountered, as a percentage of the group
Item
kepler.gl
ArcGIS Online
Unity application
Number of days
85.7
71.4
63.6
Detections on a stated date
61.9
61.9
18.2
Day of greatest activity
85.7
81.0
90.9
Terrain description
9.5
100.0
95.5
Figure 10: Usability scores and mean ratings by tool (placeholder).
07 Conclusions and summary
The thesis delivers on its stated purpose: a reproducible, freely available pipeline that turns satellite-observed fire data into a three-dimensional narrative capable of informing educators, journalists and the public in a way that existing tools, for reasons of either cost or visual flatness, do not currently provide. It establishes Unity3D as a credible geovisualization platform for this kind of work, contributes an open, NuGet-based bridge between .NET geoinformatics libraries and the Unity runtime that other researchers can build on, and leaves a clear, evidence-based path toward closing the remaining gap with commercial alternatives.
In summary, a modular, open-source Unity3D framework for immersive 3D reconstruction of real wildfire events was designed, implemented, benchmarked and evaluated with a comparative user study. The results support terrain-based 3D visualization as a precondition for correct spatial understanding and demonstrate that a freely licensed academic prototype can approach the perceived quality of established commercial platforms.
08 Downloads
The full text of the diploma thesis, the poster and the application builds are available below. Files marked as placeholders will be replaced by the final versions before submission.